Evaluate outputs of nf-core/proteinfold
Overview
Teaching: 5 min
Exercises: 5 minQuestions
Objectives
Understand the meaning of AlphaFold2 confidence scores.
Inspect the outputs
You can inspect the outputs generated by the workflow using the code below:
tree output/ -L 4
View outputs
output
├── alphafold2
│   └── standard
│       ├── sample0
│       │   ├── paes
│       │   ├── PNK_0205.1
│       │   ├── sample0_alphafold2_msa.tsv
│       │   ├── sample0_alphafold2.pdb
│       │   ├── sample0_iptm.tsv
│       │   ├── sample0_plddt.tsv
│       │   └── sample0_ptm.tsv
│       └── top_ranked_structures
│           └── sample0.pdb
├── generate
│   ├── sample0_alphafold2_report.html
│   ├── sample0_alphafold2_seq_coverage.png
│   └── sample0_coverage_LDDT.html
├── multiqc
│   ├── alphafold2_alphafold2_multiqc_report_data
│   │   ├── llms-full.txt
│   │   ├── multiqc_citations.txt
│   │   ├── multiqc_data.json
│   │   ├── multiqc.log
│   │   ├── multiqc.parquet
│   │   ├── multiqc_software_versions.txt
│   │   └── multiqc_sources.txt
│   └── alphafold2_alphafold2_multiqc_report.html
└── pipeline_info
    ├── execution_report_2025-11-16_13-42-54.html
    ├── execution_timeline_2025-11-16_13-42-54.html
    ├── execution_trace_2025-11-16_13-42-54.txt
    ├── nf_core_proteinfold_software_mqc_versions.yml
    ├── params_2025-11-16_13-42-58.json
    └── pipeline_dag_2025-11-16_13-42-54.html
Primary outputs
The workflow extracts
pAE,ipTM,pTMandpLDDTscores in a model agnostictsvformat.The atomic coordinates of the structure prediction with the highest confidence can be found in the
sample0_alphafold2.pdbfile.Summary reporting information can be visualised in the
sample0_alphafold2_report.htmlfile.
-
After the workflow has completed, view the
sample0_alphafold2_report.htmlfile located in theoutput/generate/directory. -
You can find the file by navigating to the
exercises/exercise2/output/generate/directory in the VSCode file browser on the left-hand panel. -
Right-click the
sample0_alphafold2_report.htmlfile and selectPreview.
Predicted local distance difference test (pLDDT)
pLDDT is a measure of the local confidence of each residue and is typically interpreted in 4 bands:
- Very high confidence: pLDDT >
90 - Confident:
90> pLDDT >70 - Low confidence:
70> pLDDT >50 - Very low confidence: pLDDT <
50
Low pLDDT often coincides with regions of intrinsic disorder.
External resource: EBI AlphaFold guide - pLDDT
Challenge
What conclusion can be drawn based on the application of pLDDT to the structure below?
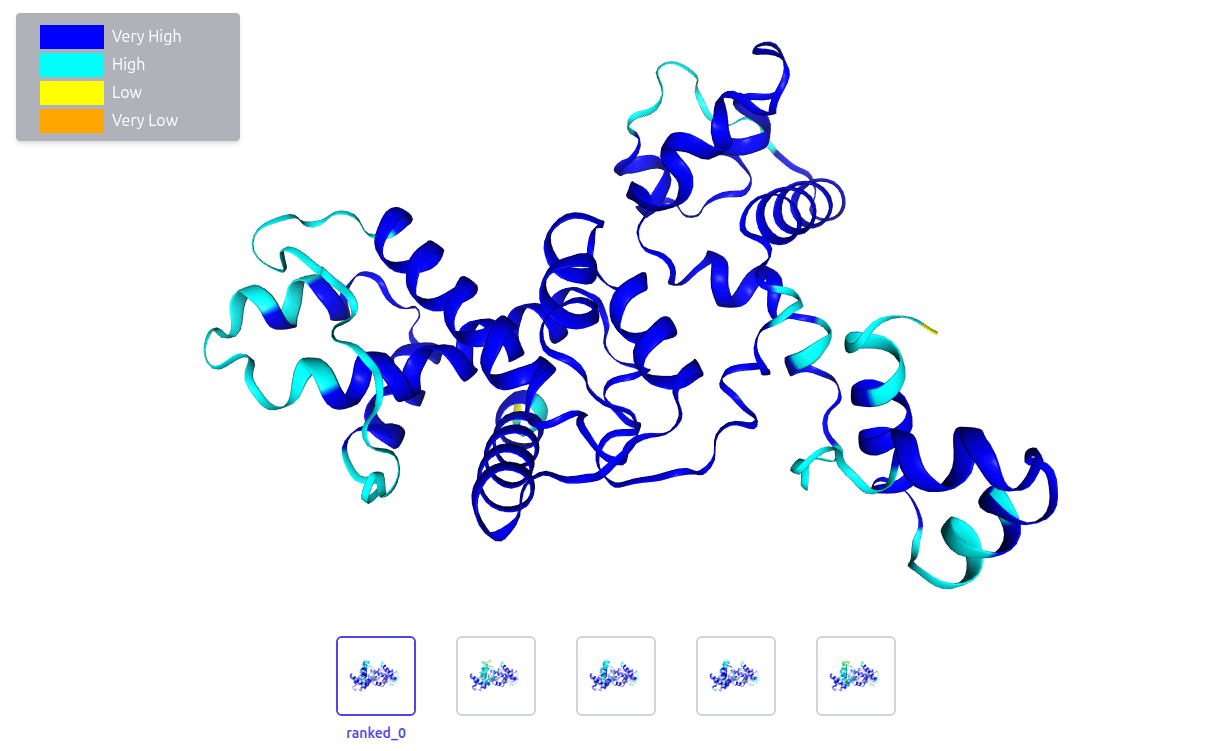
Solution
Our target structure has been predicted with high confidence.
Predicted aligned error (pAE)
- A low pAE is indicated by a dark green color and is often interpreted as high confidence about the relative positions of the 2 residues.
pTMis a score calculated from the best row of the pAE matrix and represents an overall quality score.ipTMis the same score but only considering PAE between different chains.
Background: PAE
- When we do know the true structure of a protein, the “aligned error” is the distance between a predicted atom and it’s true position after superimposing the 2 structures.
- When we do not know the true structure, we can predict what the hypothetical aligned error would be (pAE).
- Each row of the pAE matrix (i,j) represents the pAE of residues (j) assuming that the structures are superimposed based on residue (i).
External resources:
Challenge
What does the pAE matrix below indicate?
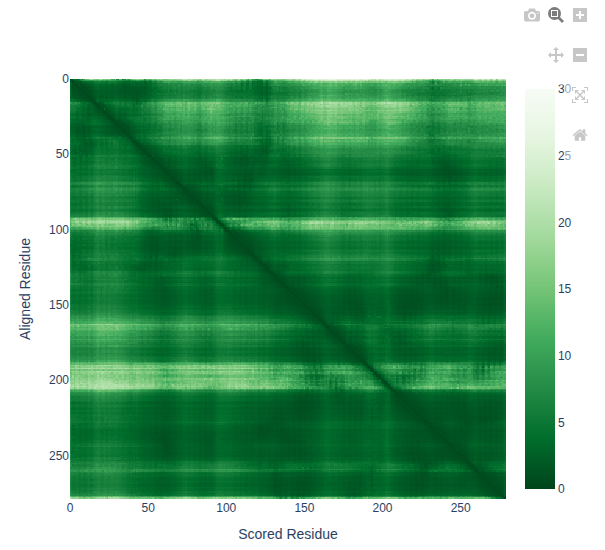
Solution
Our target structure has been predicted with high confidence.
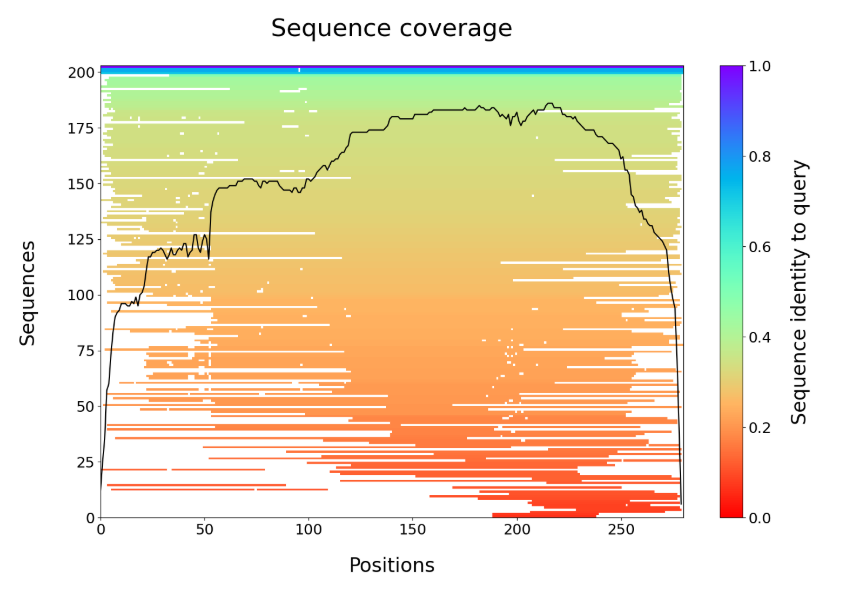
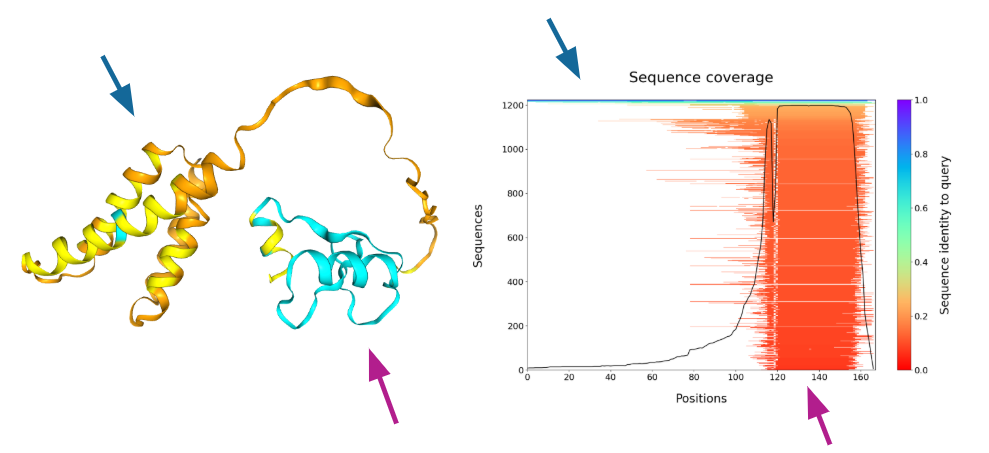
Sequence coverage
Recall that high quality predictions of novel structures rely on co-evolution data derived from multiple sequence alignments.
If our structure prediction is poor quality, it may be because insufficient sequences were identified to produce a high-quality prediction.
In our case, we have identified ~200 sequences with good coverage of our target protein (see figure below).
There are several other outputs in the examples/ directory.
How would you interpret the output reports in the following two challenges?
Challenge 1
After the workflow has completed, view the
example1_alphafold2_report.htmlfile located in theexamples/directory.You can find the file by navigating to the
exercises/exercise2/examples/directory in the VS-code file browser on the left-hand panel.Right-click the
example1_alphafold2_report.htmlfile and selectPreview.
Solution 1
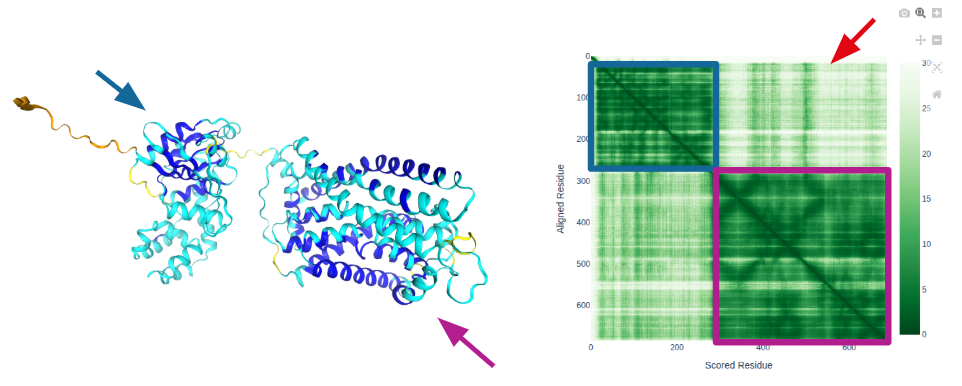
Interpretation:
- This protein contains 2 domains that are confidently predicted.
- The relative position of the two domains is uncertain
- The N-terminus is likely disordered
Challenge 2
After the workflow has completed, view the
example2_alphafold2_report.htmlfile located in theexamples/directory.You can find the file by navigating to the
exercises/exercise2/examples/directory in the VS-code file browser on the left-hand panel.Right-click the
example2_alphafold2_report.htmlfile and selectPreview.
Solution 2
Interpretation: The N-terminal domain is predicted with low confidence - likely due to low MSA coverage.
Key Points
Structure predictions should be interpreted in the context of model confidence.